23 Apr COVID-19: Using economic indicators to shed light – Architectural Billings Index
LEADERS OF AEC FIRMS CAN LOOK TO KEY INDICATORS FOR VALUABLE BUSINESS INSIGHTS
As the world comes to grips with COVID-19, it is challenging to predict what will happen in the coming months amidst this period of uncertainty. However, as leaders of AEC firms, you can use key economic indicators to gain a glimpse into where the economy might be heading.
Leading indicators, measures that point to future trends, and coincident indicators, which inform the current situation in real-time, can be used to better understand the economy now and moving forward. AEC firms have a wide range of indicators to choose from that can provide valuable business insights. As we learn more about the crisis, we’re starting to see some data that add further clarity. In this article, we will focus on the Architectural Billings Index, updated for March 2020 earlier this week.
WHAT IS THE ARCHITECTURAL BILLINGS INDEX?
Tracked by the American Institute of Architects (AIA) through their “Work-on-the-Boards” survey, the Architectural Billings Index (ABI) measures the percentage of firms it surveyed that reported stronger demand for their services, in terms of billings, design contracts, and project inquiries. While the ABI is not a direct measure of demand – the index’s survey does not normally ask for numbers such as total billings – it gives a general understanding of current market sentiments. The ABI is a leading indicator that is reported on a monthly basis, where a score above 50 indicates an increase in levels of nonresidential construction activity. As leaders of AEC firms, you can use this data to inform strategic planning, determine business cycle shifts, and understand the timing for making important decisions in the changing economy. The ABI is considered to have 9 to 12 months of lead time and has accurately predicted previous economic recessions. For Canadian firms, this index can serve as a useful tool in conjunction with Canada-specific indicators.

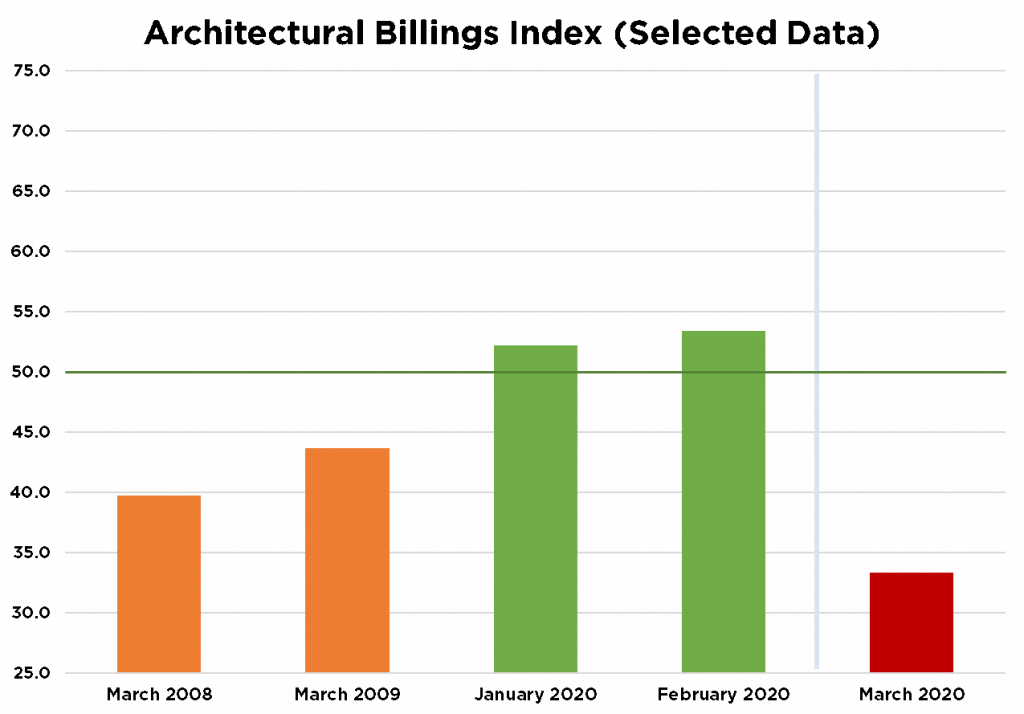
Figure: Selected Statistics for the Architectural Billings Index
From February to March 2020, demand for billings declined rapidly, from 33.3 to 53.4. Demand for design contracts was even lower, down to 27.1 from 52.0. As shown in the figure above, the ABI for this March was even lower than during the same period in the 2008-09 economic recession, where March 2008 was considered a record low at the time.
ARCHITECTURE FIRMS EXPECT ON AVERAGE 17% REVENUE LOSSES
Due to the unique circumstances of COVID-19, the AIA asked respondents additional questions in the March survey to further understand how architectural firms are responding to the crisis. From the results, on average, architecture firms now expect revenue losses of 17% over the next three months, which have and will require numerous staffing changes to counteract the downturn. A statistic such as this can be valuable by giving a comparison for how your firm is performing relative to competitors and the economy overall.
HOW CAN THIS INFORMATION HELP YOU?
Indicators can be highly useful tools to give either a snapshot of a point in time or a prediction of the future. Although the current ABI can be alarming in isolation, economic indicators are only pieces of the bigger picture. Leaders need to make proactive strategic decisions supported by key indicators to implement this data effectively. For our clients, we support their strategic planning efforts, forecasting financial projections based on measures of performance and developing implementation plans to respond to our analyses. With the right data-driven strategy and led by strong leadership, your firm can weather this crisis and even emerge stronger than before.
Written by Christopher Kim, Assistant Consultant
April 23, 2020
Sources
- https://www.aia.org/pages/6288434-abi-march-2020-architecture-firm-billings
- https://www.architecturalrecord.com/articles/4390-architects-billings-plummet-to-all-time-low
- https://www.architecturalrecord.com/articles/4919-architectural-billings-index-jumps-8-points


